To maximize contact requests and user engagement on Parato's website, we implemented an iterative UX analytics project. With the help of Hotjar, we collected user data on the basis of which we iteratively developed and tested optimization suggestions.
Parato is a network of over 500 digital experts with a common goal: to support SMEs in their digital transformation - from consulting to implementation. The Parato website serves as an important channel for showcasing the experts' skills and acquiring new projects. In order to exploit the website's full potential, we carried out a UX analytics project together with Parato.
Hotjar, a tool for analyzing user behavior, was used to collect data on user interactions with the website. Hotjar visualizes quantitative and qualitative user data, for example as heat maps or session recordings. Among other things, this allows conclusions to be drawn about how far users scroll, which elements they click on most frequently and where there are bounces.
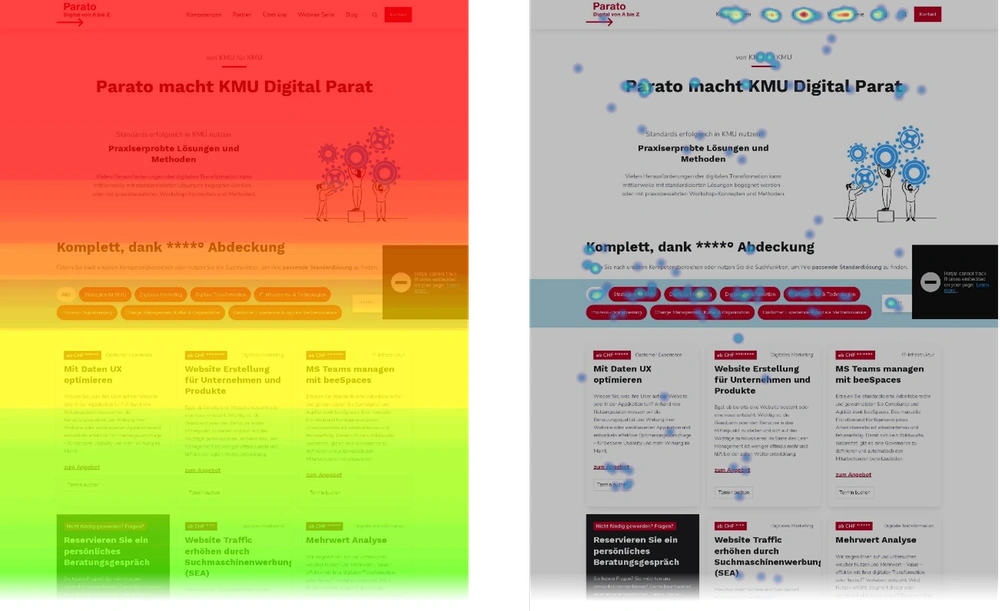
Fig. 1: Scrollmap (left) shows how many users scroll how far down a page. On the right-hand side, the heatmap shows where users have clicked. The visualization of the aggregated data helps to interpret the causes that led to user behaviour.
The initial analyses of user behavior on the website showed that many users did not act in a targeted manner and often left the site without entering the contact funnel. This became particularly clear through the session recordings, in which we were able to observe how individual users interacted with the website in the form of video recordings.
Based on these findings, we worked with Parato to sharpen the target behavior of users: customers should be directed to the contact funnel with just a few clicks or interact with the content of the website, for example in the form of whitepaper downloads.
In order to promote this target behaviour, various iterative adjustments were made to the website, such as optimizing the hero section with less text and clear calls to action and redesigning the filter chips. The effectiveness of these and other changes could be checked using new user data in order to gradually arrive at the optimized website. In total, we went through three iterations over a period of four months.
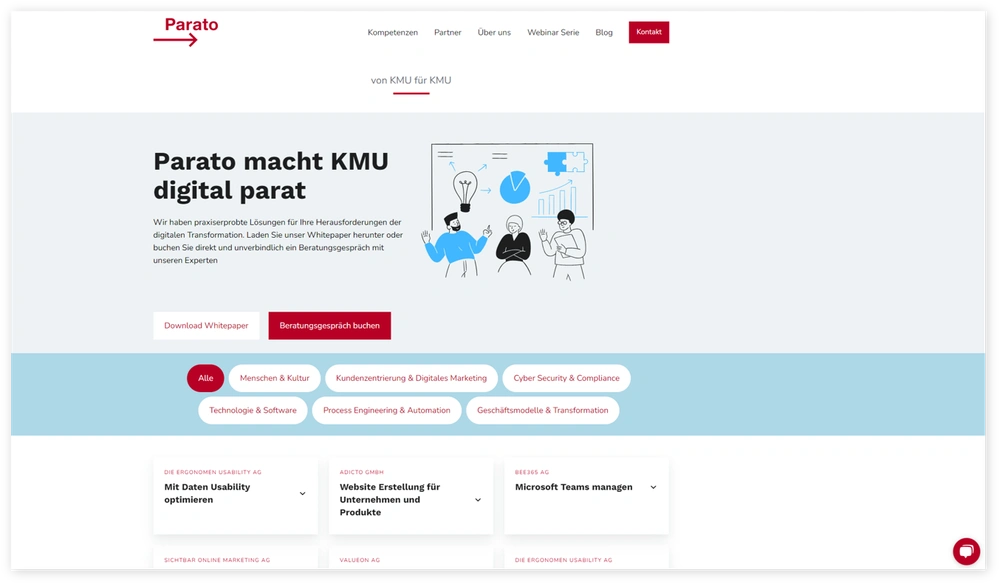
Fig. 2: Optimized Parato homepage according to the continuous improvement process.
Thanks to targeted advice from the Ergonomen and the use of UX analytics, Parato's website was optimized effectively and precisely. The data-driven adjustments made it possible to exploit the website's full potential and ensure Parato's long-term success through increased engagement and contacts.